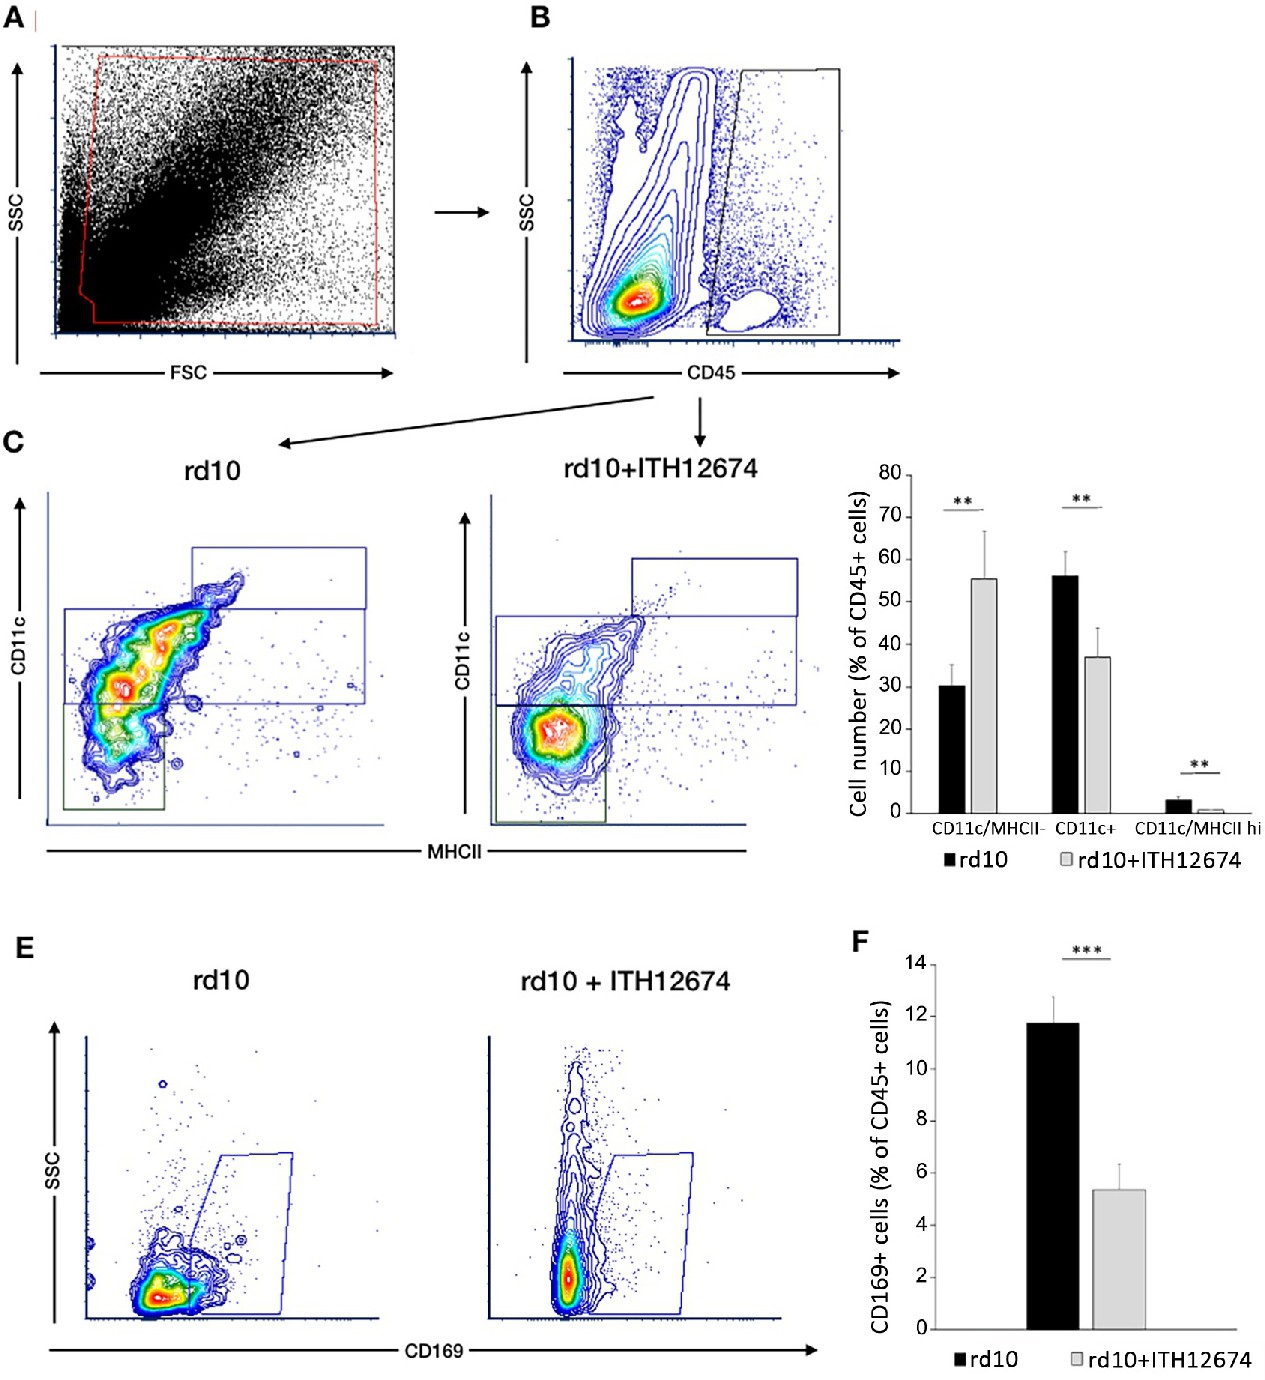
Fig. 8. Effect of ITH12674 on the immune cell populations in the retinas of rd10 mice. Whole retinal cells from non-treated and ITH12674-treated (10 mg/Kg) rd10 mice were labeled with a cocktail of five antibodies: PE-conjugated anti-CD11b, FITC-conjugated anti-CD45, PerCpCy5.5-conjugated anti-CD11c, PECy7-conjugated anti-MHC class II (I-A/I-E), and eFluor 660-conjugated anti-CD169, and analyzed by flow cytometry. (A) Dot plot representing SSC against FSC of a whole mouse retina. (B) The CD45-positive cells were gated. (C) Double plots presenting CD11c and MHC class II immunofluorescence of CD45+ cells. Image shows data from a single representative experiment in each condition. (D) Bar graph showing different phenotype populations (% of CD45 positive cells) labeled with anti-CD11c and MHC class II antibodies from non-treated and ITH12674-treated mice. (E) Contour plots representing SSC against CD169 expression of CD45+ gated cells. Image shows data from a single representative experiment in each case. (F) The graph shows mean values of CD169 positive population (% of CD45 positive population) in each condition. Each dot plot is representative of a minimum of four independent replicates. Data are mean values ± SEM. **P<0.001.